Follow

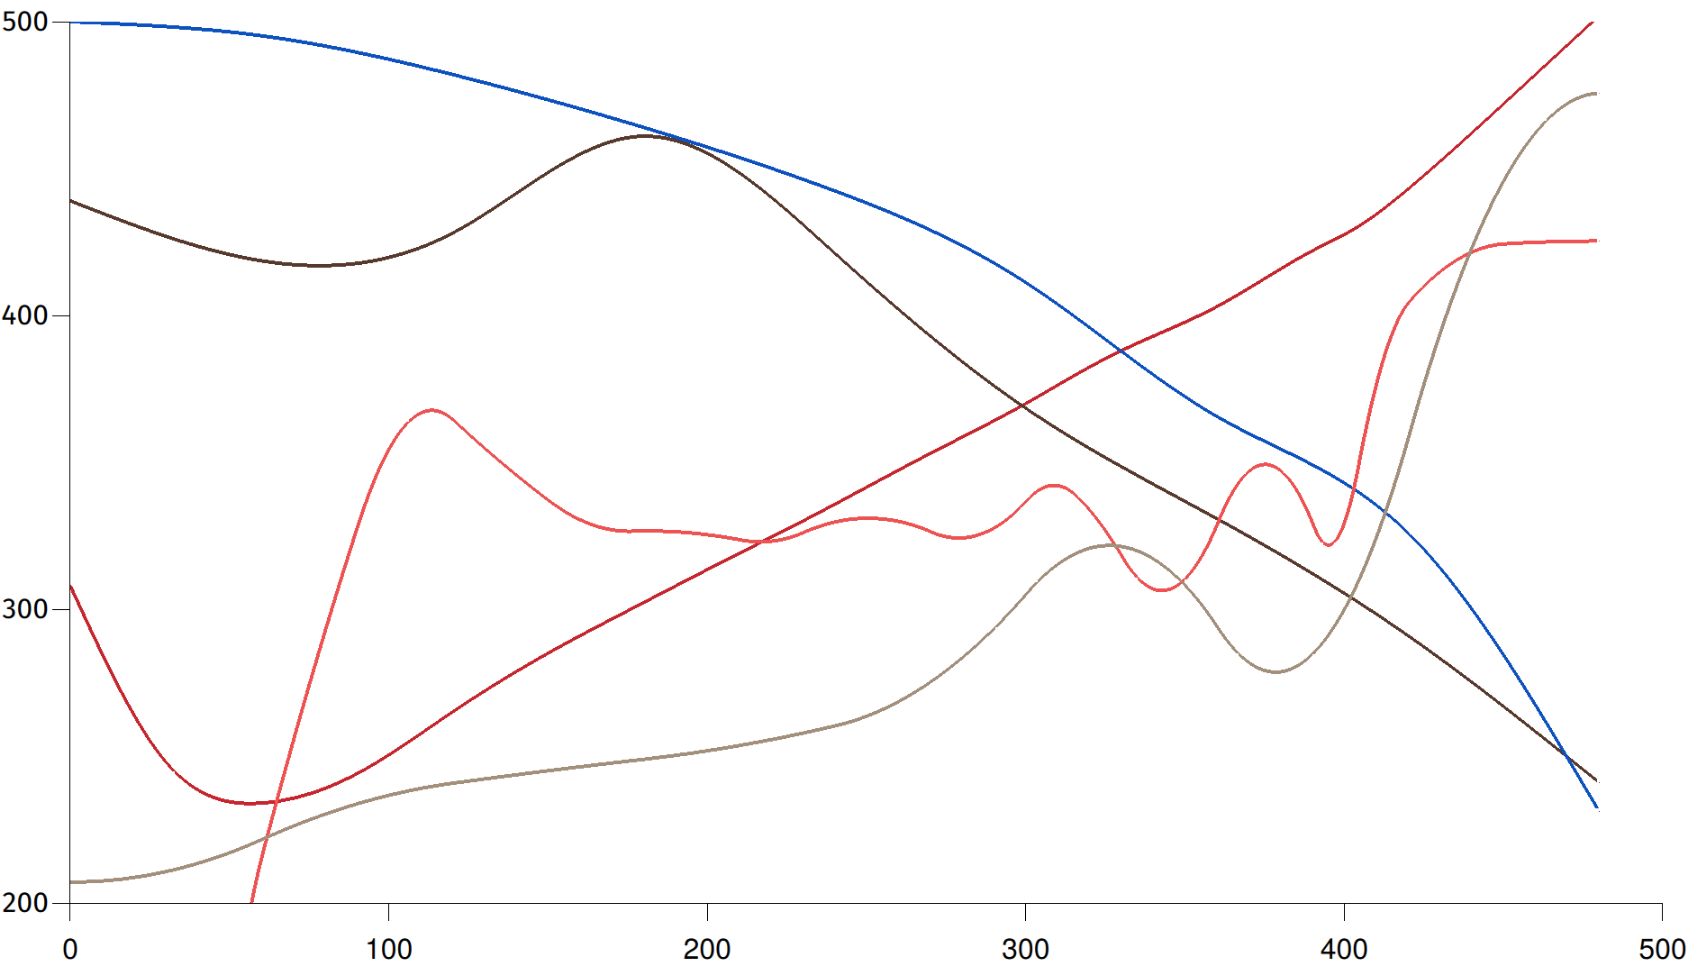
Rate of temperature change and inverse rate of mass change overlaid. This combination of measurements gives you a strong visual indication of blanch point, first crack, and second crack even if you have no idea how my machine calibrates compared with yours. It's also a mess.
Also, it looks a little bit like Nessie.
I should probably build a video on this slide, or at least dissect that in the next episode of Coffee and Code.

The really neat thing about that mass rate curve is that you can see as first crack is finishing, the rate of mass loss settles back down to where a linear progression from pre-1C would have been (until 2C kicks in and pushes mass loss rate back up again).