Follow

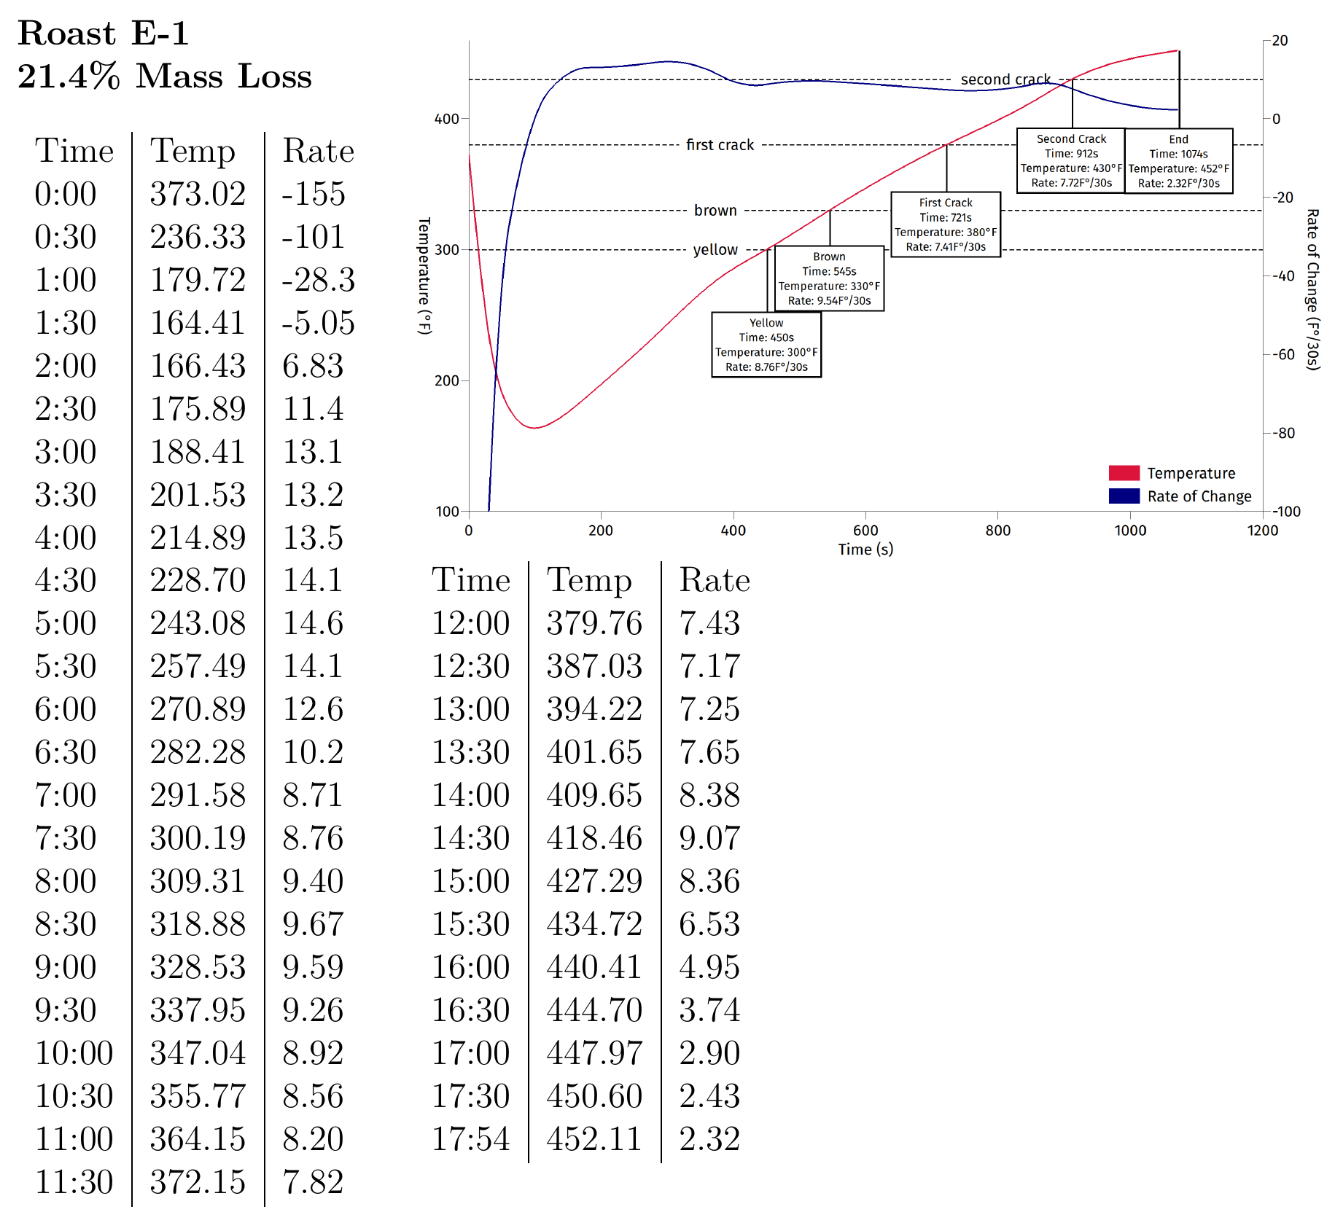
This is how the batch with the highest mass loss ended up looking. The numbers in the notes hanging off the graph are all generated directly from the underlying roasting data. Measurements in the table are mostly interpolated since it's rare to get measurements exactly on the second. They end up based on 2 measurements less than half a second on either side, so not much difference compared with taking either the previous or next measurement.