Follow
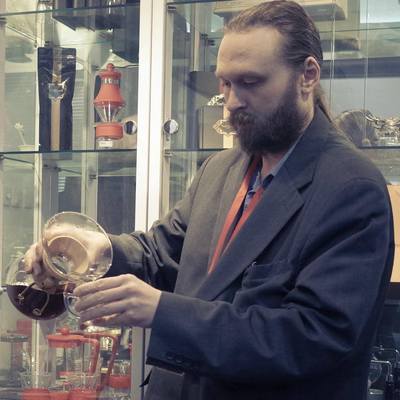
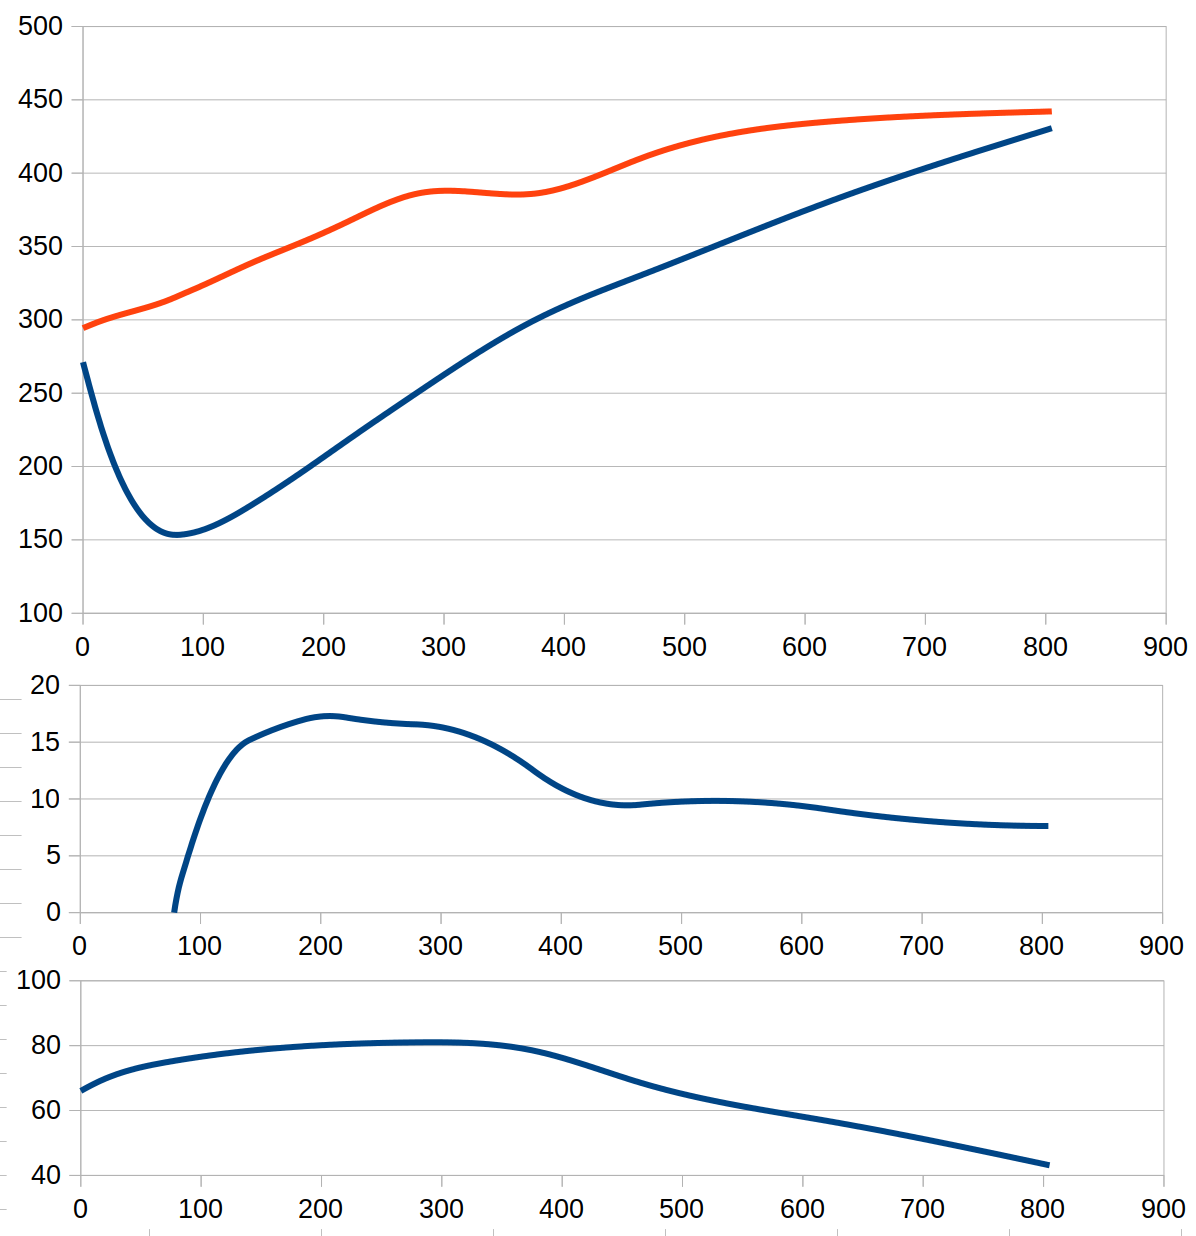
Some example data that I pulled together for an upcoming coffee roasting class. The top section shows the temperature of the coffee and inlet air, from which you can get a good sense of the control strategy in play. Below that is rate of change of the coffee temperature. Then below that is a visual spectrum (roaster camera) approximation of the Agtron gourmet scale roast level over time which isn't saturated out of range at the start because this is a decaf coffee which already starts out brown.