Follow

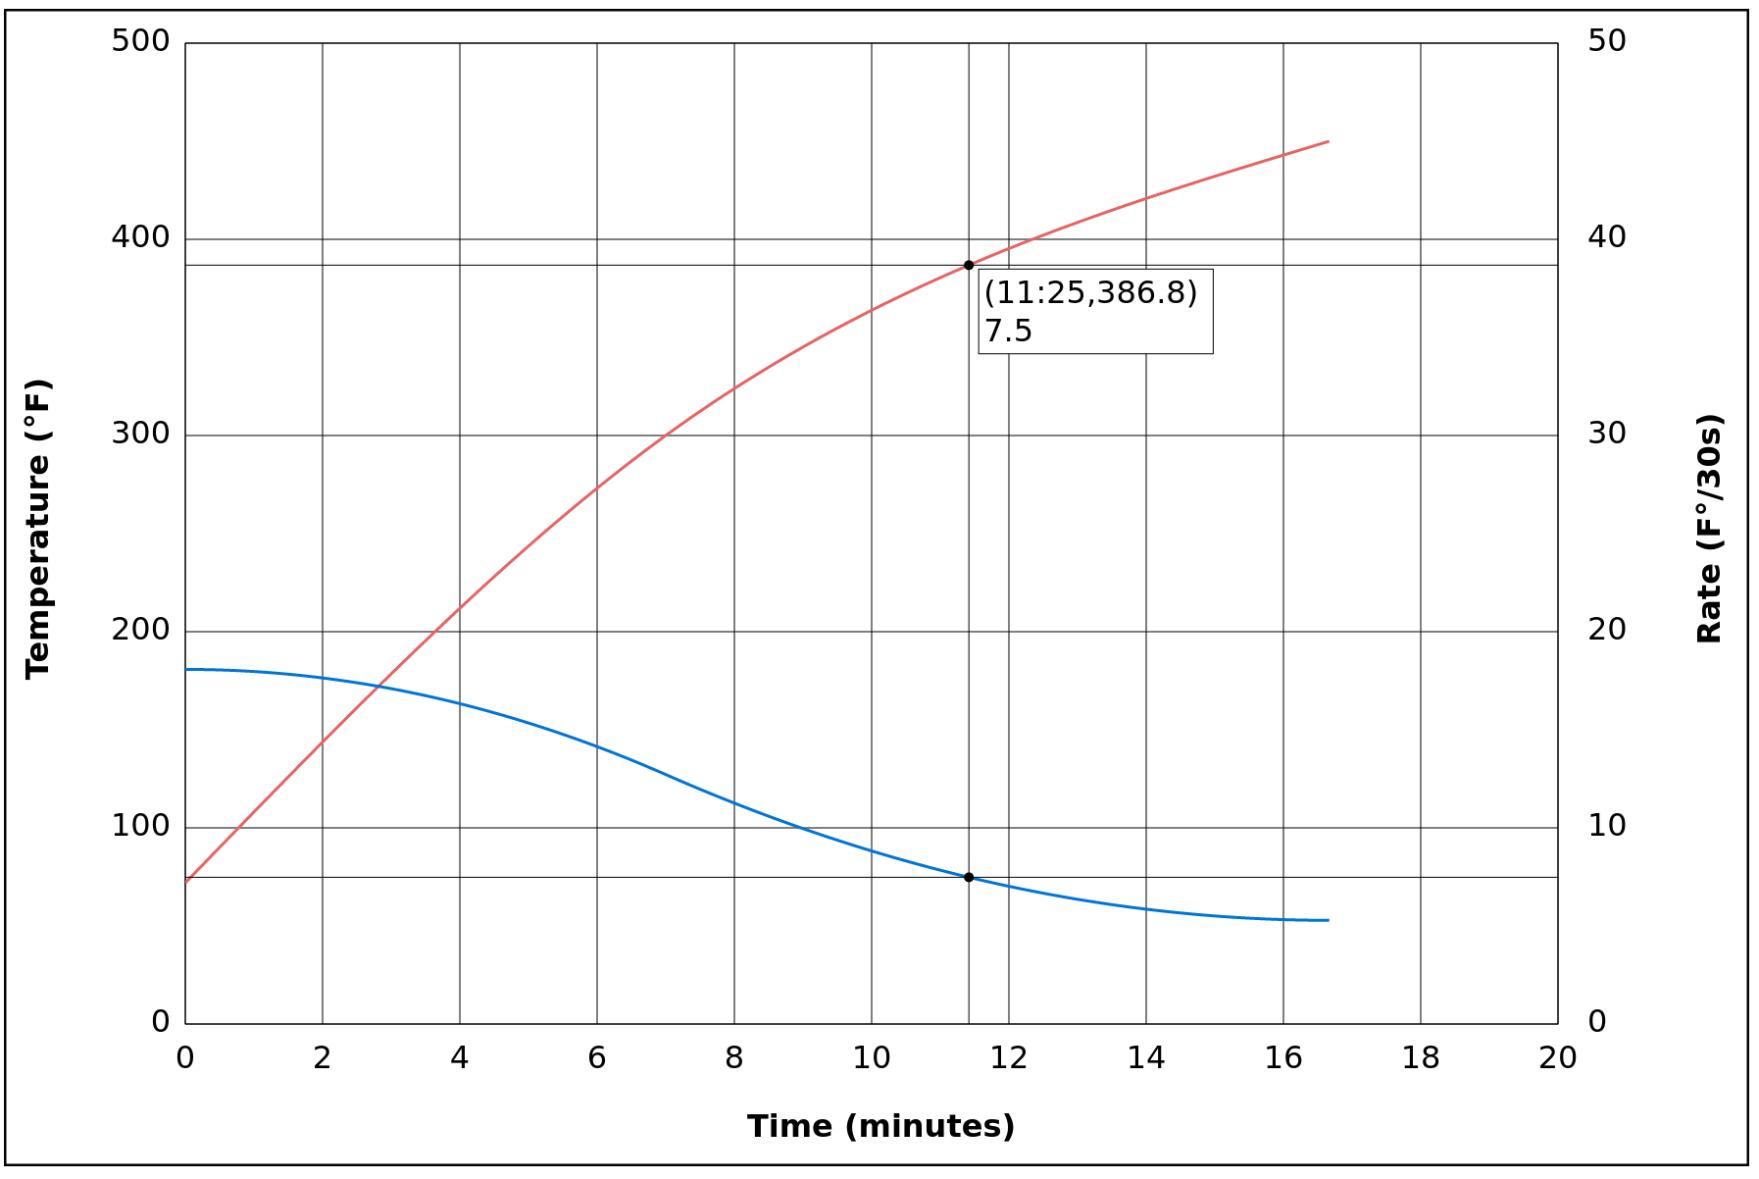
Added the ability to mouse around the graph and get some useful information in response. The vertical line follows the x position for the mouse while the horizontal lines show the temperature and rate of change given in the plan for the given time. A text box gives all three values.
This may or may not be related to my general dislike for user interfaces that involve fussing with boxes on screen when all I really want to do is just type in the exact values I want and have the computer respect that.

I've considered also letting people click to set control points and edit the curve that way, but I've used editors that work that way and hate it. Mouse cursor just doesn't have the precision to make that a good experience and I shudder to think how awful that would be on a phone or tablet.