Neal Wilson ✅ @neal@social.typica.us
- Software
- https://typica.us
- Send Money
- https://typica.us/payment.html
Admin
Author of Typica software for coffee roasters.
Joined Apr 2018
Good month for video royalties from Amazon. 13 cents.
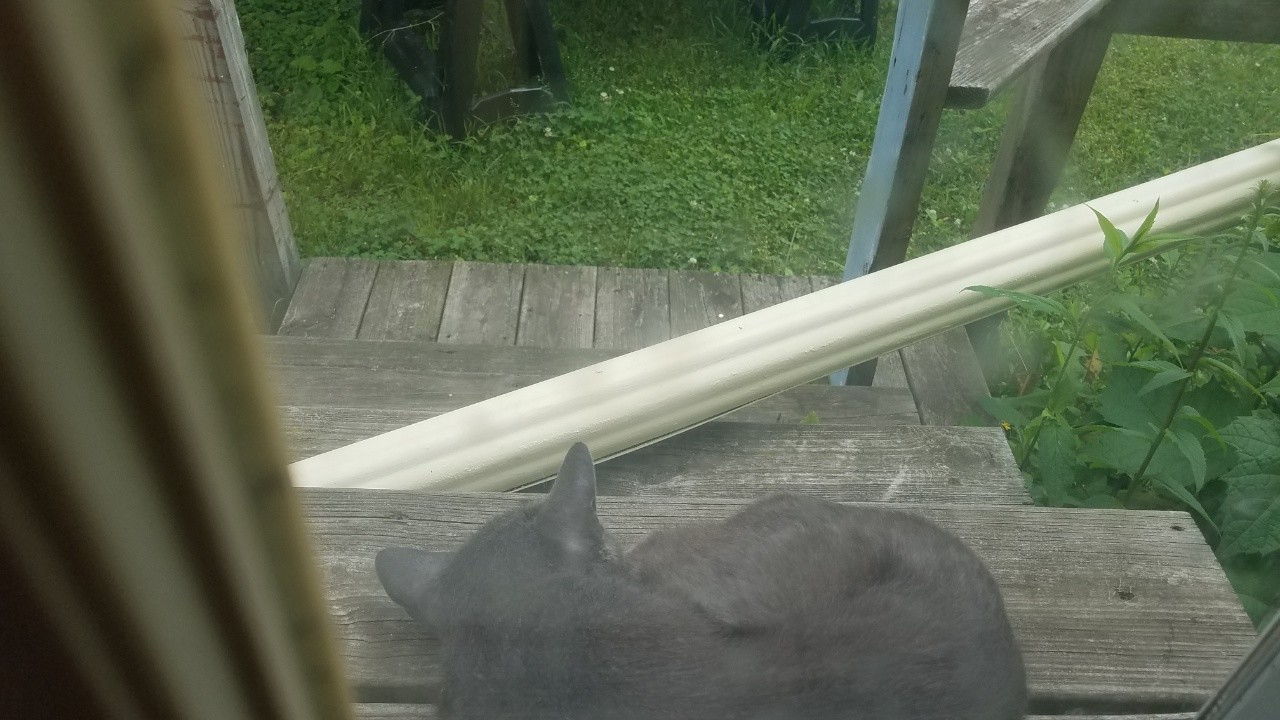
The phone gets really hot when the cat sleeps on it while it's charging. I should probably not let her do that.
candy corn on the cob
Neal Wilson ✅
boosted

I need a hug. Fortunately, I live with a cat that likes hugs.
Neal Wilson ✅
boosted

Had to reply to a customer's email that the product they wanted me to recommend is not something that actually exists.
My laptop bag has been working on falling apart for a while now and I think it's about time to replace that. I like the fabric on the current one, though, so I should try to pull the stitches and see about turning it into other stuff once I have a replacement.
Someone left a book at the shop (we have a shelf where people can abandon their books or freely take books others have left behind) featuring one of the Internet's celebrity cats and it's a little sad because I know that particular cat is dead.
alc
Having more wine with a cat on the label.
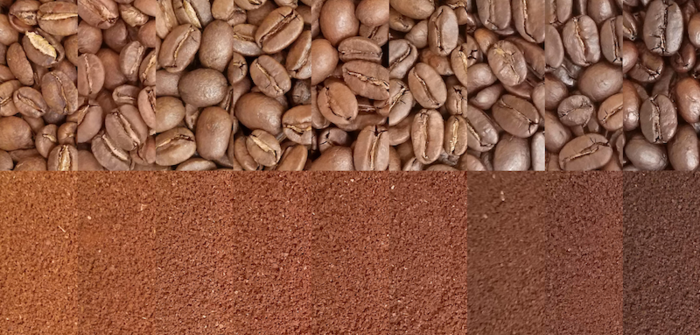
Sent out a bunch of IKAWA profiles for students in yesterday's class. I had 16 of those for a variation on the workshop done with that roaster, 8 batches that go from light to dark roasts then 2 batches with timing variations (faster and slower) for while the coffee is yellow, brown, between cracks, and beyond 2nd crack.

Back porch cat is still there, was watching me cook a late lunch.
Back door cat is still napping.
Today's online class had more technical difficulties than I'd like but overall seemed to go very well. Lots of positive comments from students.
There's a cat at the back door. Guess I'm not going outside. (it would disturb the cat)
Puyo Puyo Tetris has a decent plot as far as Puyo Puyo or Tetris games go.
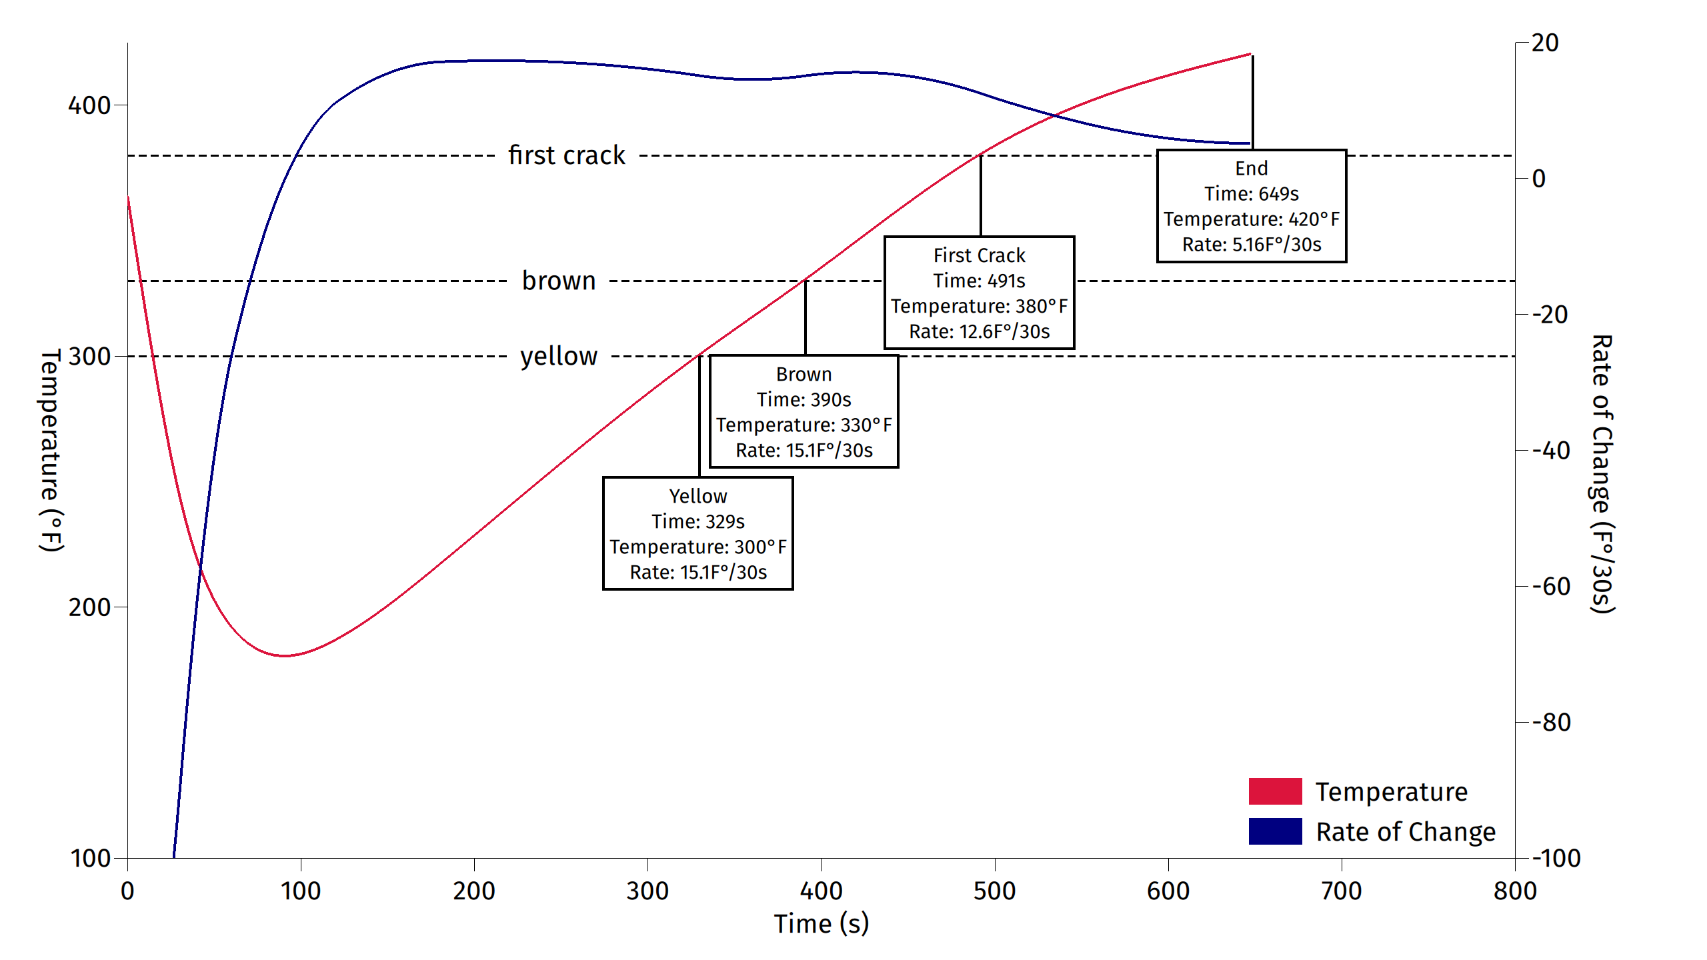
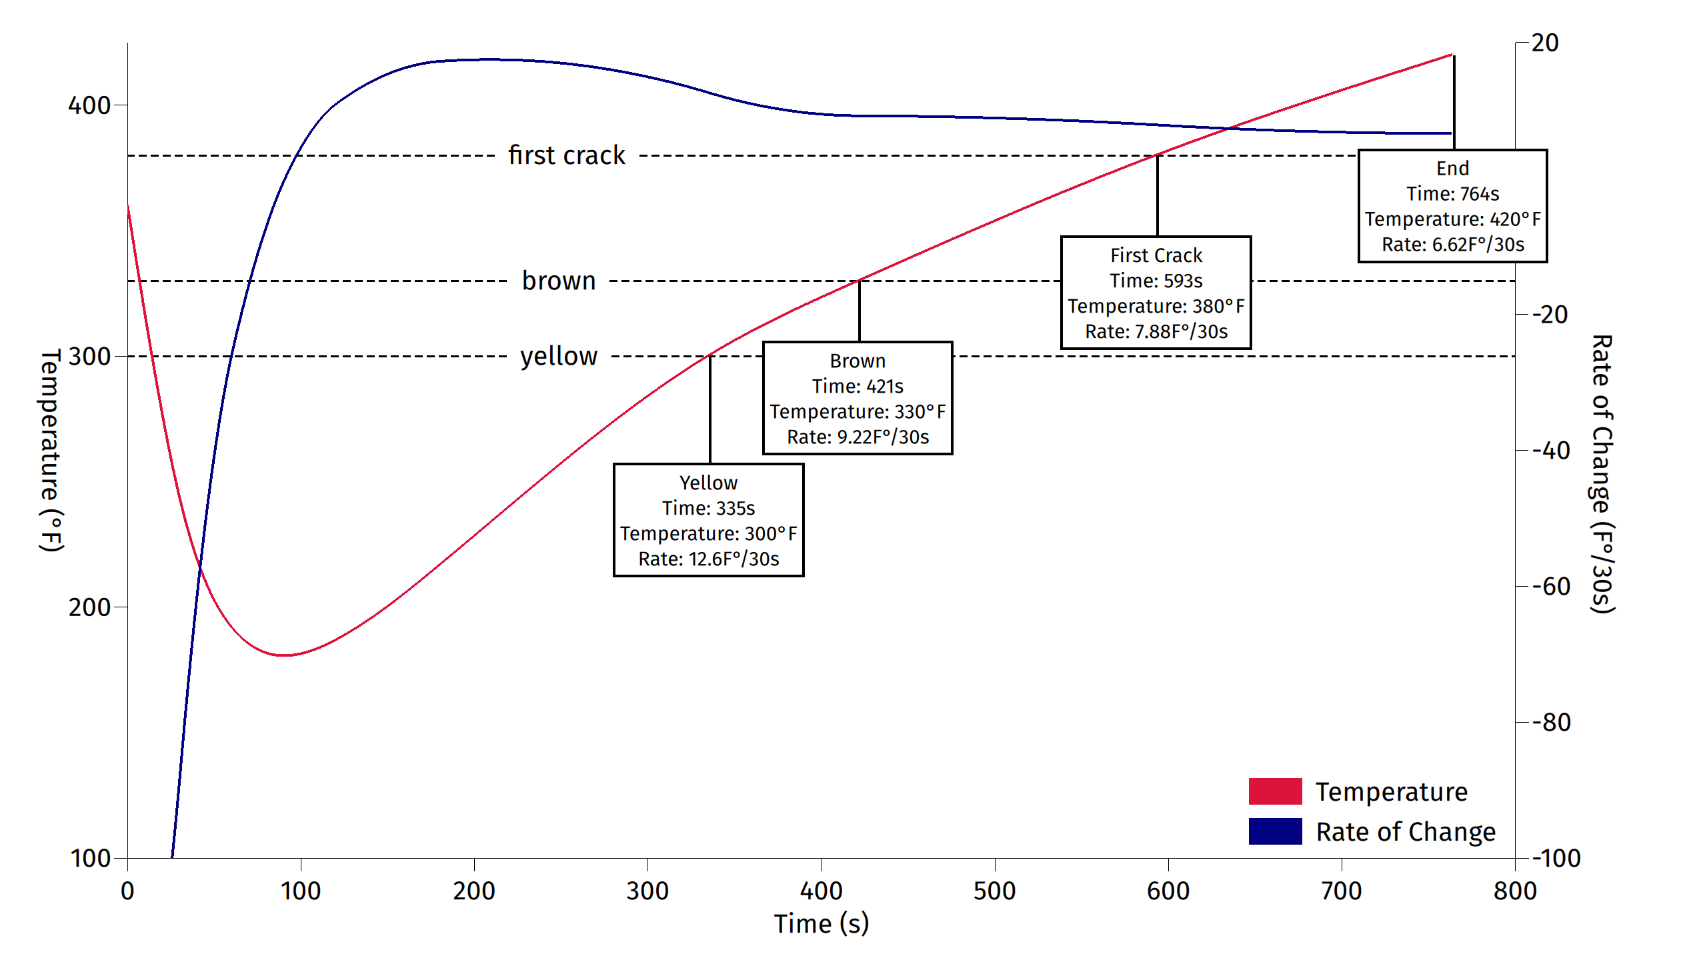
Here are the graphs. B-1 has a 15.71% mass loss and the ground coffee measures 53.7 on the Agtron gourmet scale. B-2 has a slightly higher 15.86% mass loss and a slightly lighter 53.9 degree of roast. Those post-roast measurements are closer than some roasters get trying to follow the same plan but these are clearly very different roasts.
Going through the roasting data for tomorrow's class and I'm really excited about the B-1 and B-2 pair. I roasted these to the same ending temperature but according to extremely different roasting plans (B-1 is a pretty extreme profile), ending up with ground degree of roast and percent mass loss measurements that are almost identical, so it's a great example to show the limits of using those numbers as a proxy for consistency. I think I need to add another slide for this pair.
- Software
- https://typica.us
- Send Money
- https://typica.us/payment.html
Admin
Author of Typica software for coffee roasters.
Joined Apr 2018