
Neal Wilson ✅ @neal@social.typica.us
- Software
- https://typica.us
- Send Money
- https://typica.us/payment.html
Admin
Author of Typica software for coffee roasters.
Joined Apr 2018
Neal Wilson ✅
boosted

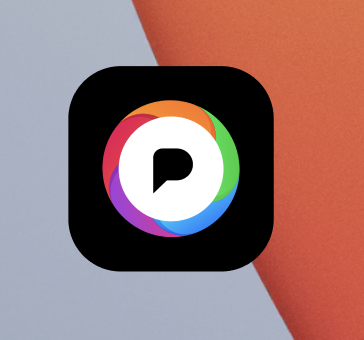
Help me pick the new @pixelfed default app logo!
Like == black background
Reblog == color background
What's kind of shocking about this is I know the code I've written for this is pretty awful and the way this works under the hood is ridiculously inefficient, yet it's all responding instantly so I have to wonder what's wrong with other people's code to eat up all that performance?
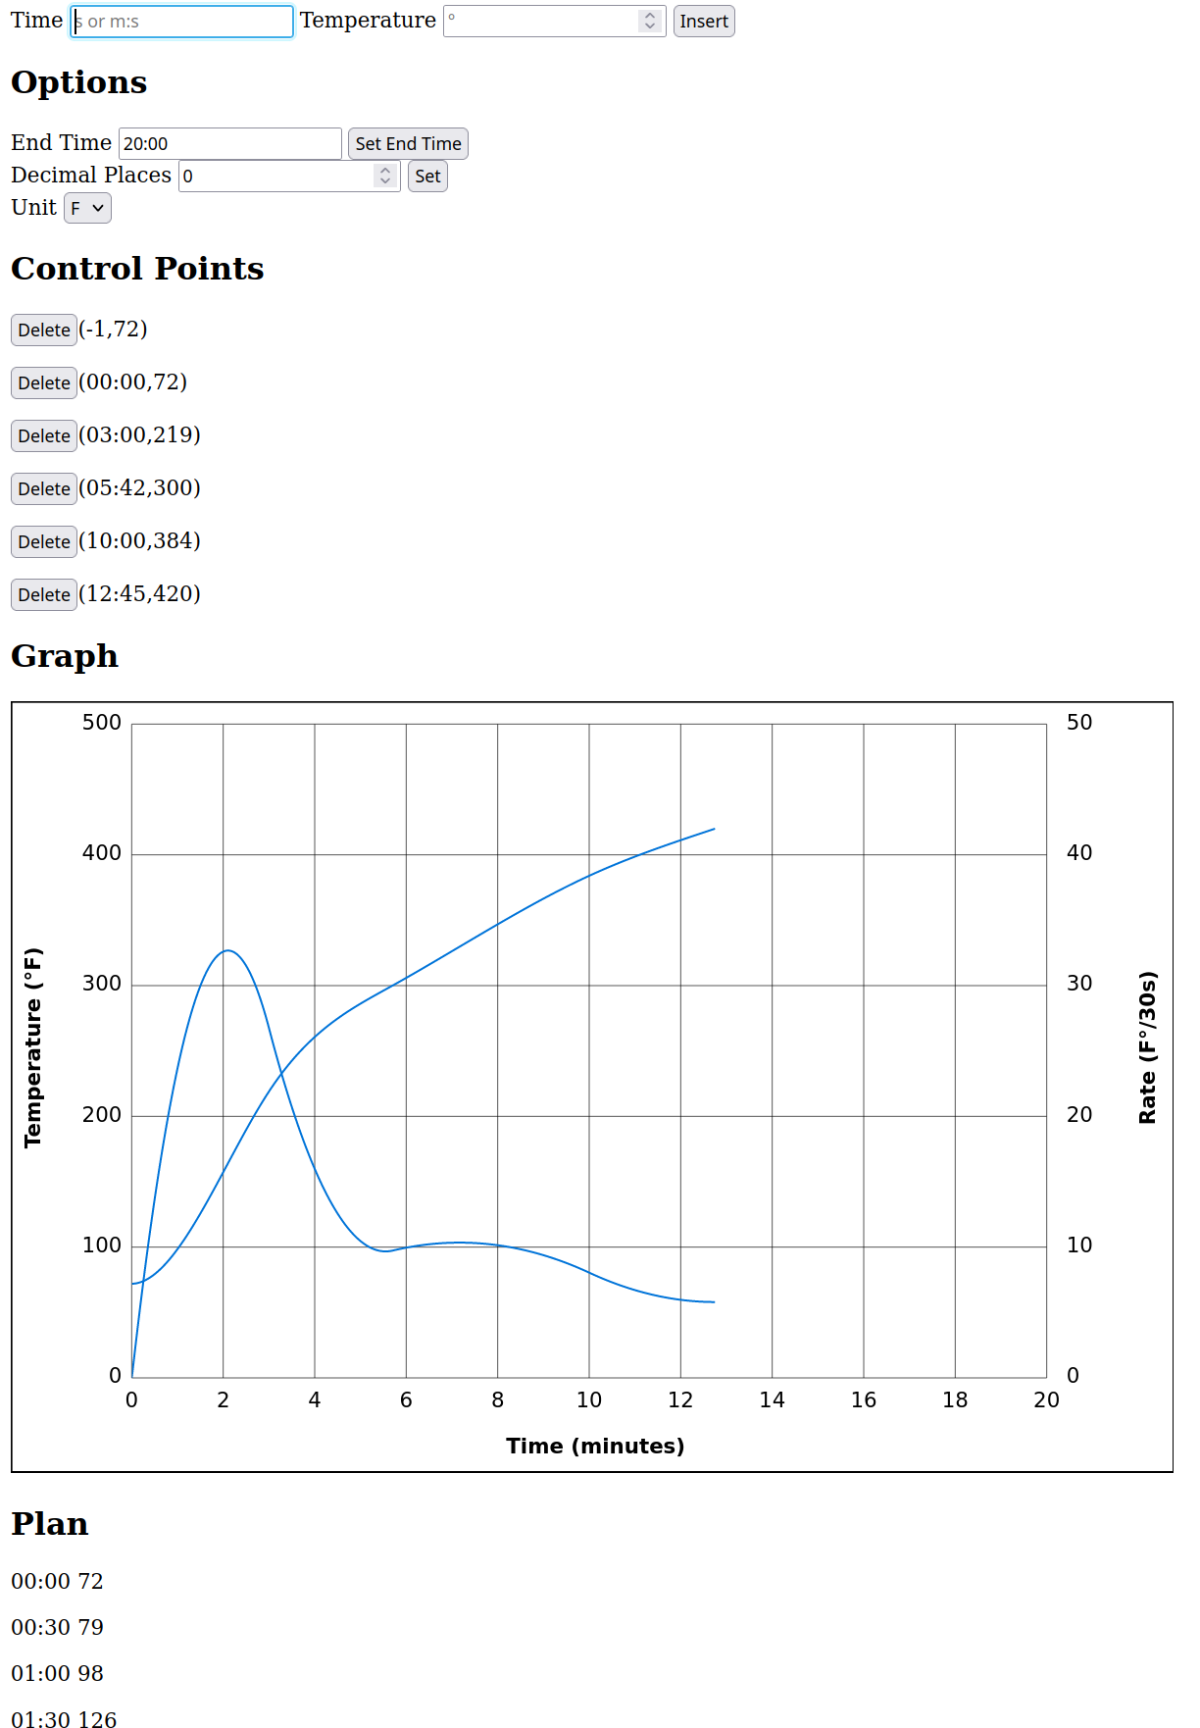
Fixed the default colors (different data series are now different colors) and put in user controls for axes and colors. If you set those to ranges smaller than the data you can zoom in to whatever part of the plan you want.
The main reason to use this over something else is the curve type. Pretty much all of the stuff I've seen starts from the wrong math, making it harder than it should be (but not impossible) to get a roasting plan that you can follow in this universe. This one produces the least curvy curve that passes through all the points which makes it harder (but not impossible) to create plans that you can't easily follow.
There are kind of a lot of changes and features I still want to add, but nothing too huge and the core functionality is already better than the program this is replacing.
The end time field is a handy one. By default the curve will stop once you reach the final control point, but if you set the end time farther out it'll extend the curve to the specified time. You can also set it earlier to get a shorter roasting plan without changing the shape of the part you're keeping. Useful for the case of deciding you want to try roasting something a little lighter or darker.
A little preview of a thing I've been working on lately. The layout and visual design is far from finalized (there's no styling on the HTML at all) and there are at least a few more features that I want to add before I upload this somewhere, but the core functionality works. You give it some control points, it produces a plan that you can roast a batch of coffee against. Below the bottom of this image there are a couple buttons for exporting the generated plan either to CSV or Typica's XML.
Graphics code worked with remarkably little fuss for a change. Still need to add in a couple more features, but the cat says it's time to stop for tonight. It's 3AM so she's probably right about that.
Tested turning on the new case (you're supposed to wait 24 hours before turning it on). It lights up and gets cold. Now I just need the electrician to return my call and get some work scheduled so this can be installed where it's really going.
Almost finished with the initial visual design for graphs out of a tool I've been working on lately. I'm starting with hand-crafted SVG before I write the code to generate that.
New refrigerated case arrived today. Very heavy, somehow got stacked on top of a 2nd skid during shipment so it's harder than it should be to get it on to the floor. Called in some extra help from people with appropriate tools.
Working on the SVG generation. Not sure if I'm going to finish that today, but this is getting close to something that I'd be willing to throw online and let other people start using.
Put in the export to Typica feature on the web thingy I've been working on. This can now officially replace my old C++ utility, though I still intend to add at least a few more features before I put it online for others to use. The next big one would be SVG generation so people can eyeball that the plan is what they had in mind before exporting that for use.
The cat has noticed that my lap did not contain a cat and moved to correct that problem.
And there is such an event coming up in a couple months.
The latter seems like the easiest option and would be handy to have at events where there may or may not be a computer hooked up to the roaster at all and if there is it's probably not set up in a way that's convenient for taking your data with you.
The other option, which I haven't seen before, would be to have a timer update the time field continuously and raise the temperature value with each insertion so you could just hit the button when the temperature gets to the next value. No typing at all.
I'm kind of tempted to add a couple of live logging features, but if I start adding stuff like that I'll definitely need to add some styling to avoid confusing people with more advanced features. One option would be an auto-increment on the time field (so once you put in a point it'll advance that to the next 30s and focus the temperature field so there's just one number to put in when it's time).
Added CSV export to the thing I'm working on. Typica export can follow the same pattern. I'm not opposed to exporting for other software, but it's not something I need so I'll move on to other features.
Did a slightly clever thing for removing control points. It puts the point removed into the controls for inserting a new point so it's fast to undo the change and easy to edit the position before reinserting it.
- Software
- https://typica.us
- Send Money
- https://typica.us/payment.html
Admin
Author of Typica software for coffee roasters.
Joined Apr 2018