Neal Wilson ✅ @neal@social.typica.us
- Software
- https://typica.us
- Send Money
- https://typica.us/payment.html
Admin
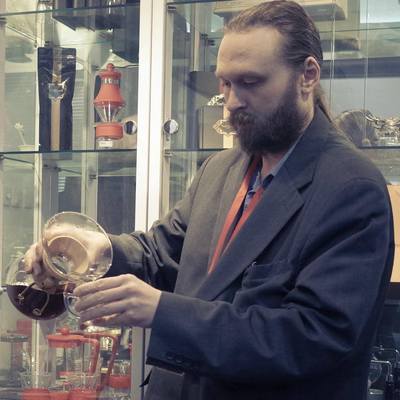
Author of Typica software for coffee roasters.
Joined Apr 2018
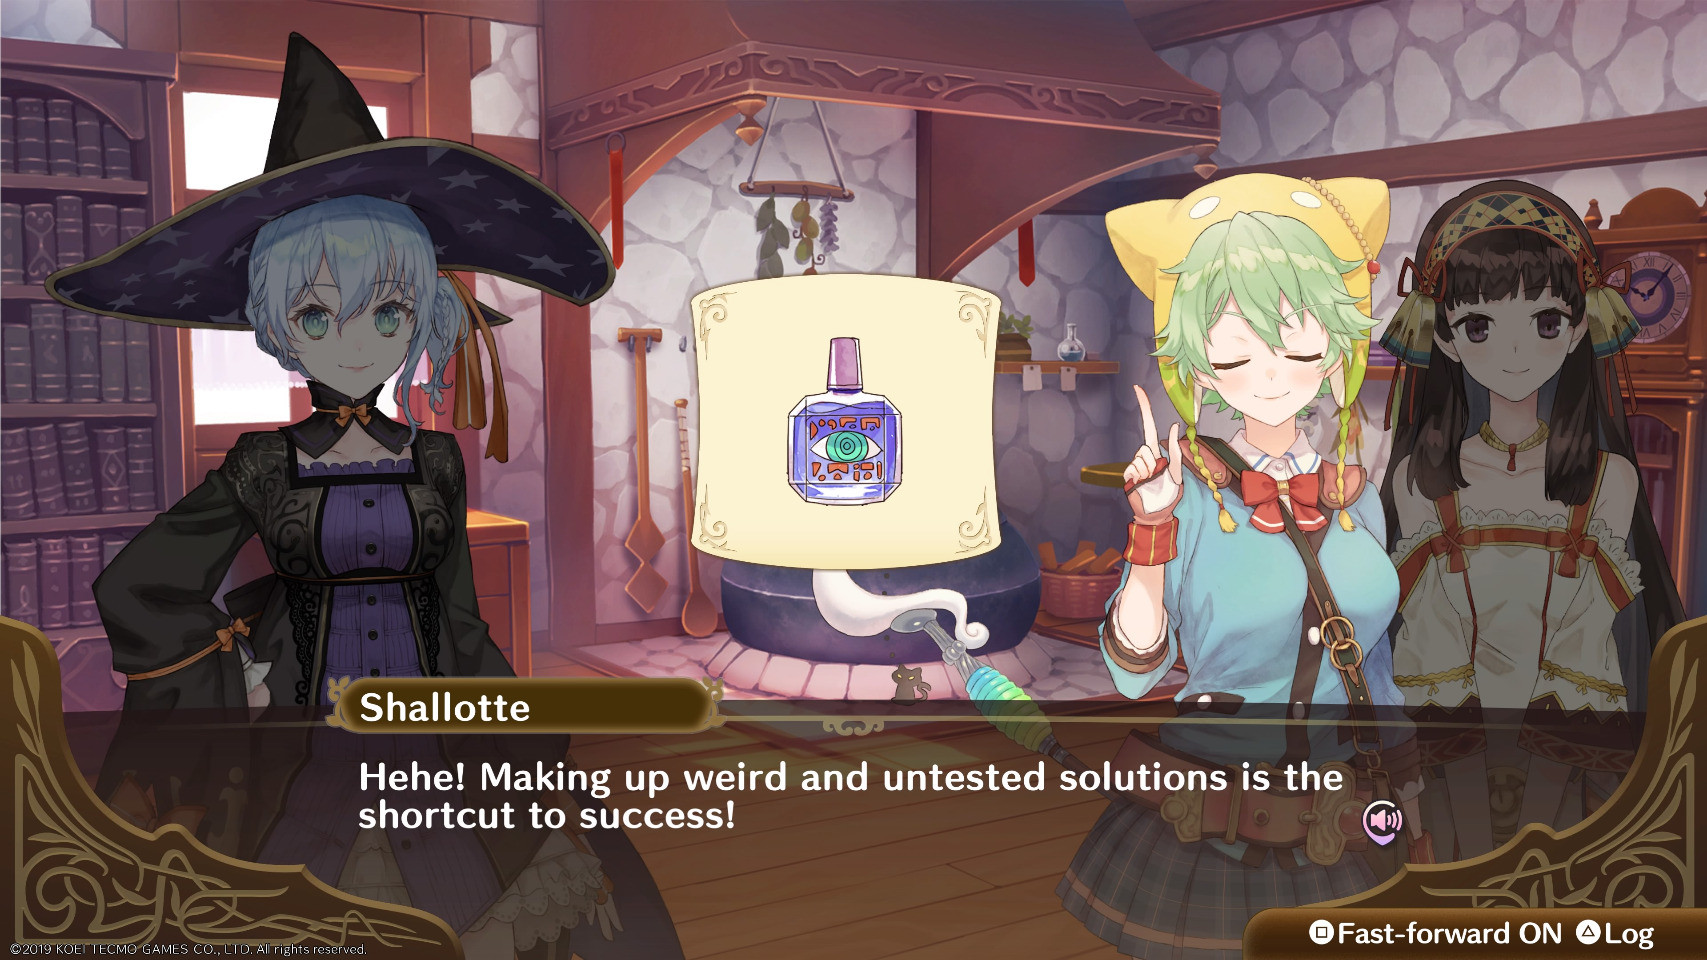
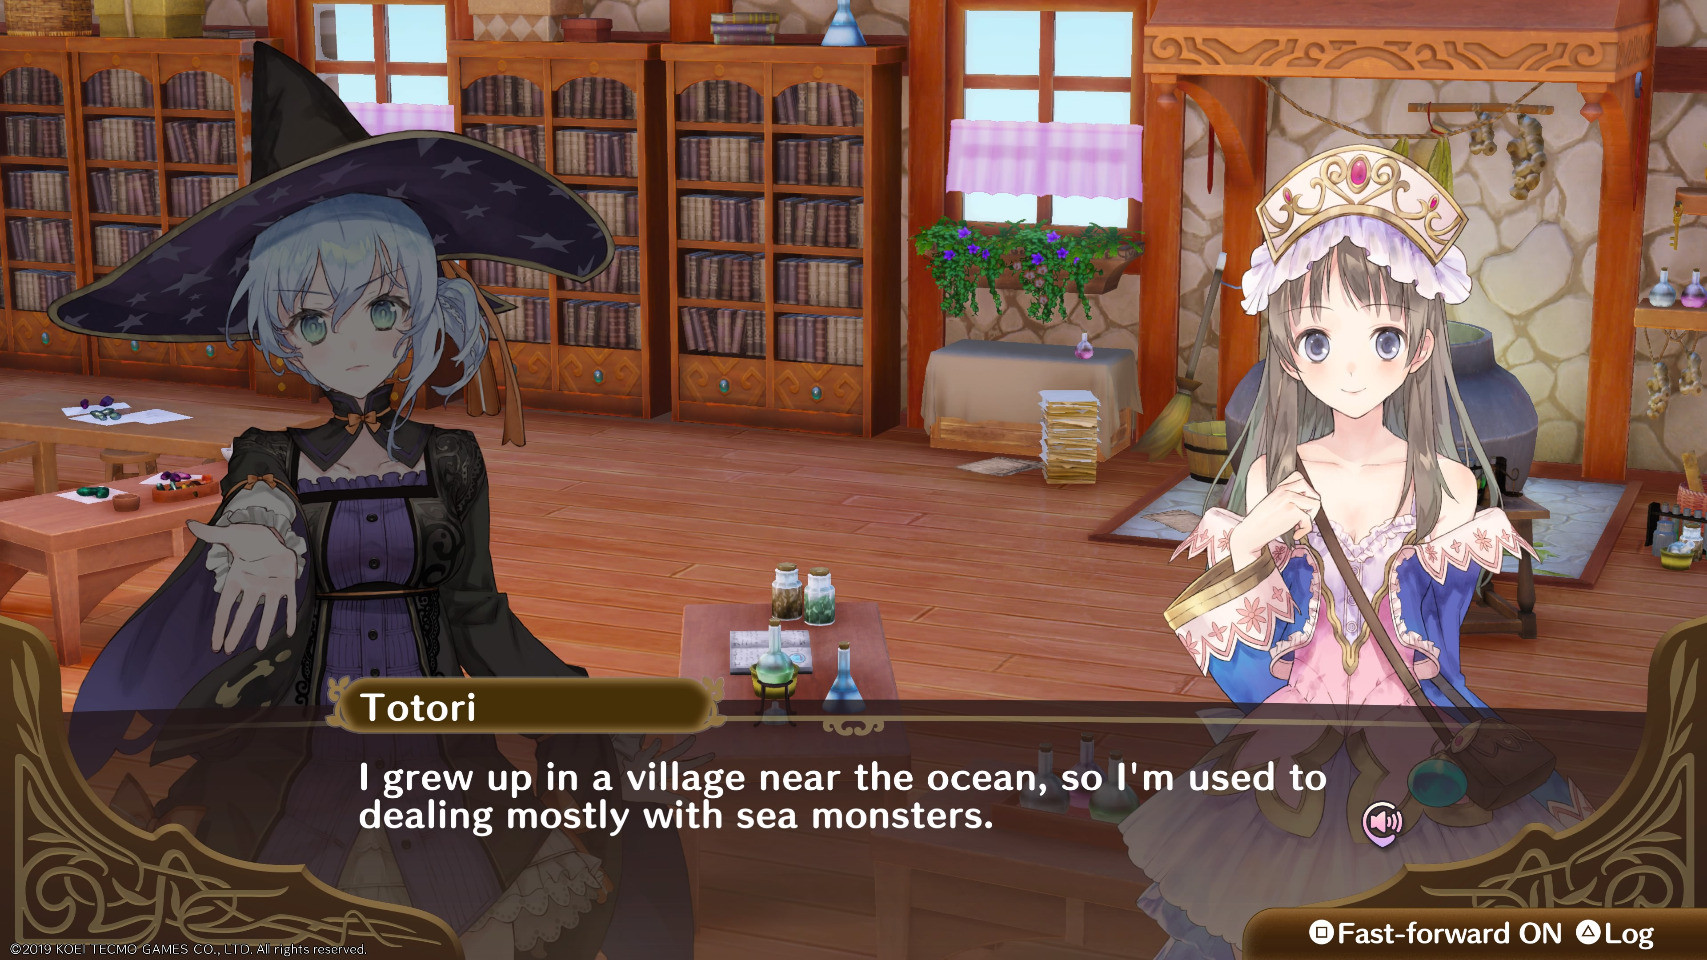
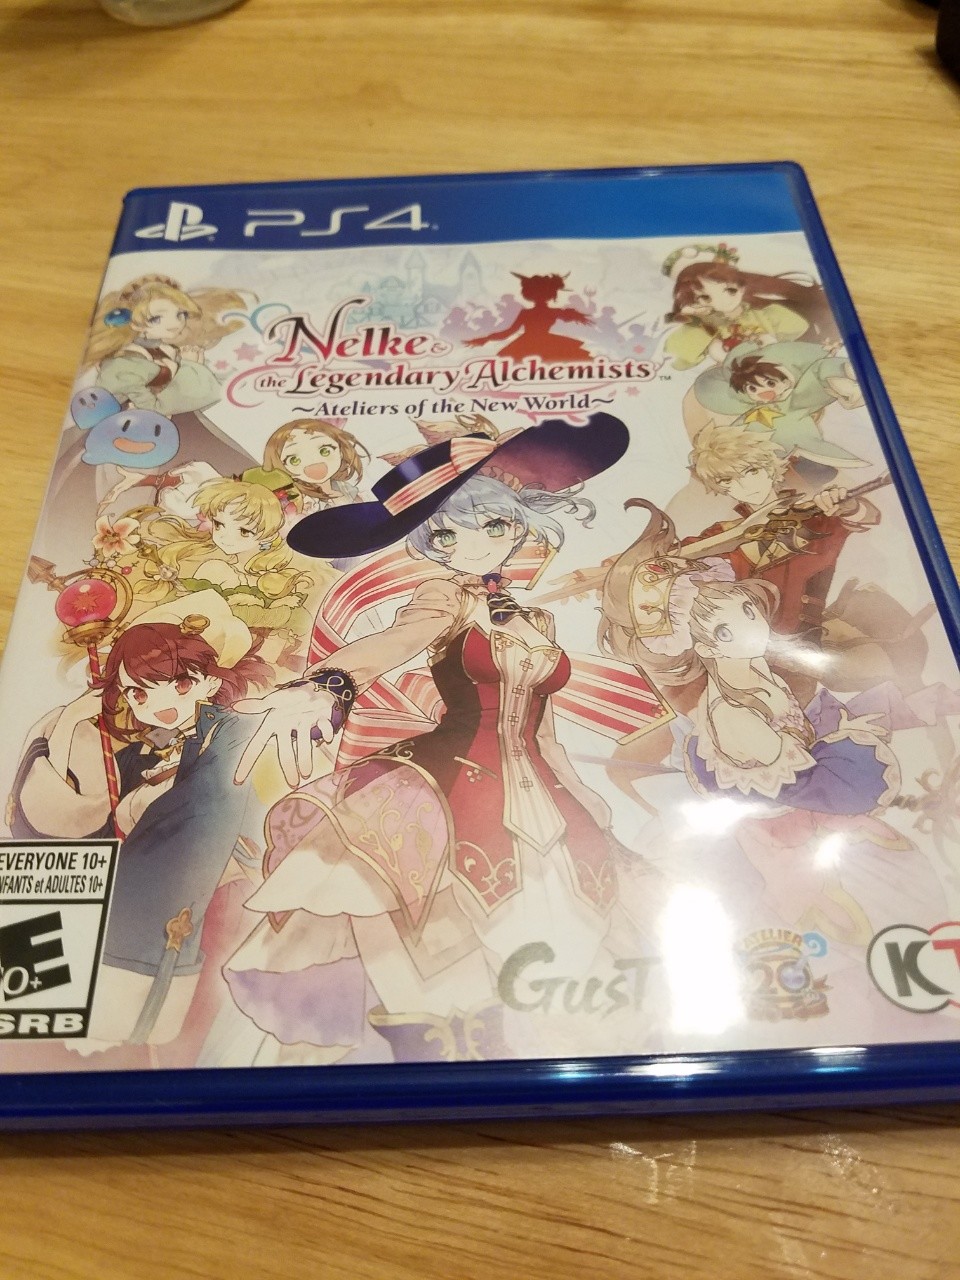
The shortcut to success. Also, I like Shallotte's hat. My winter hat is similar. #AtelierSeries
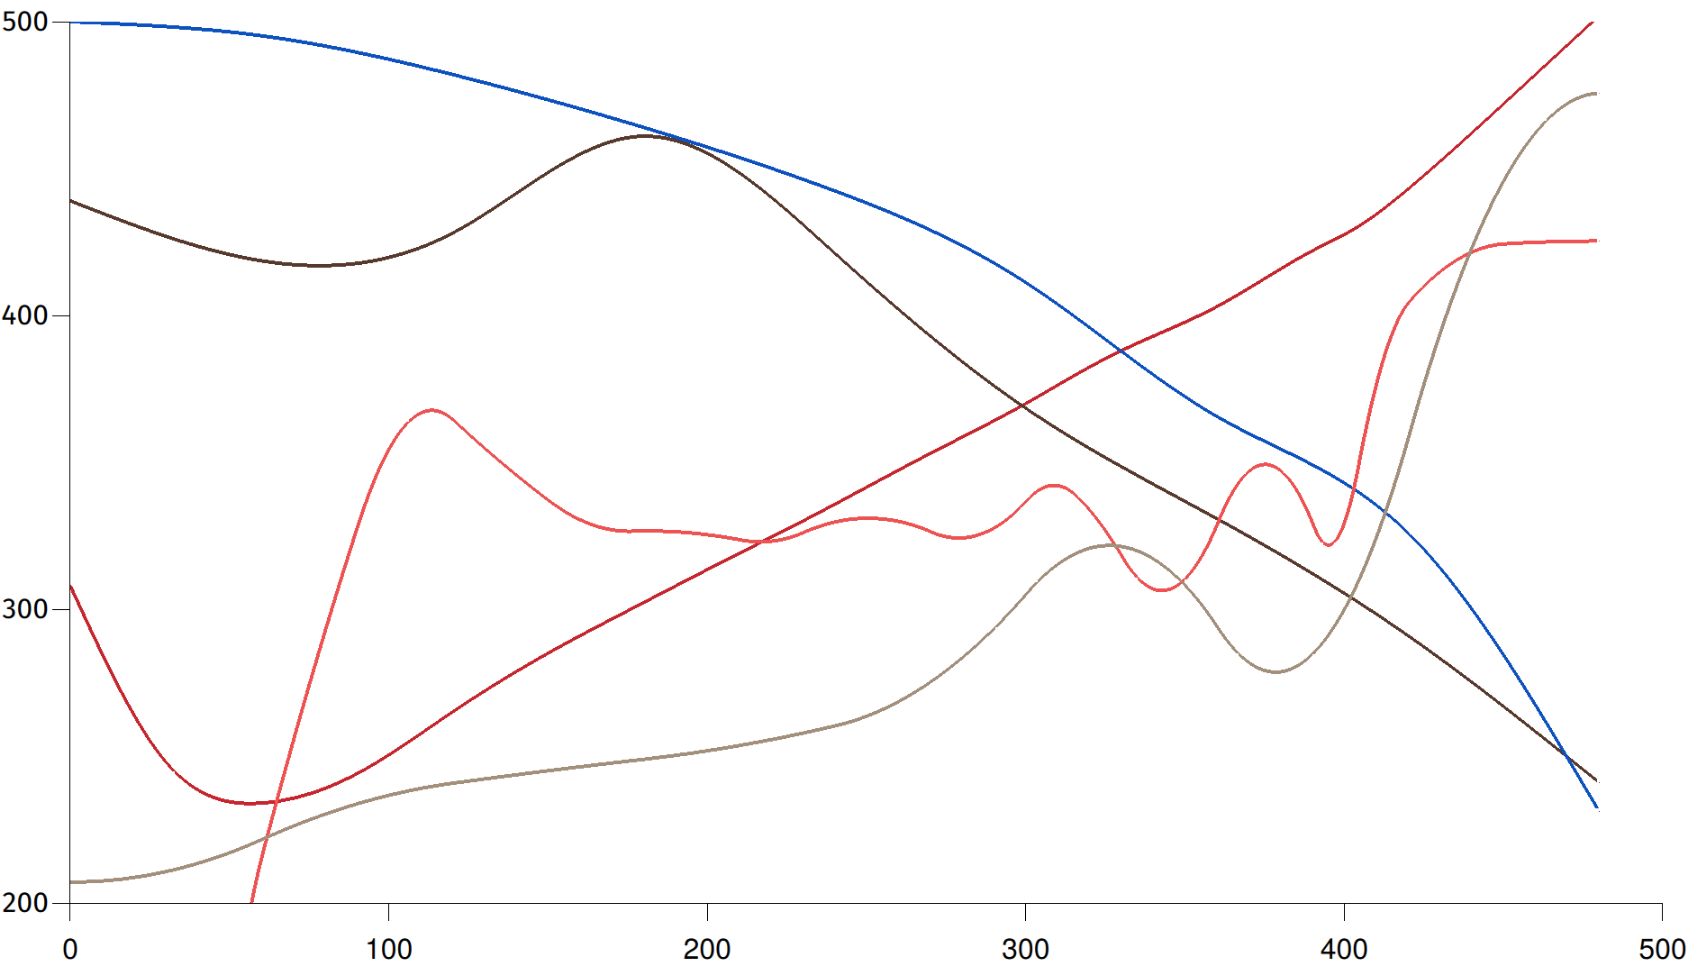
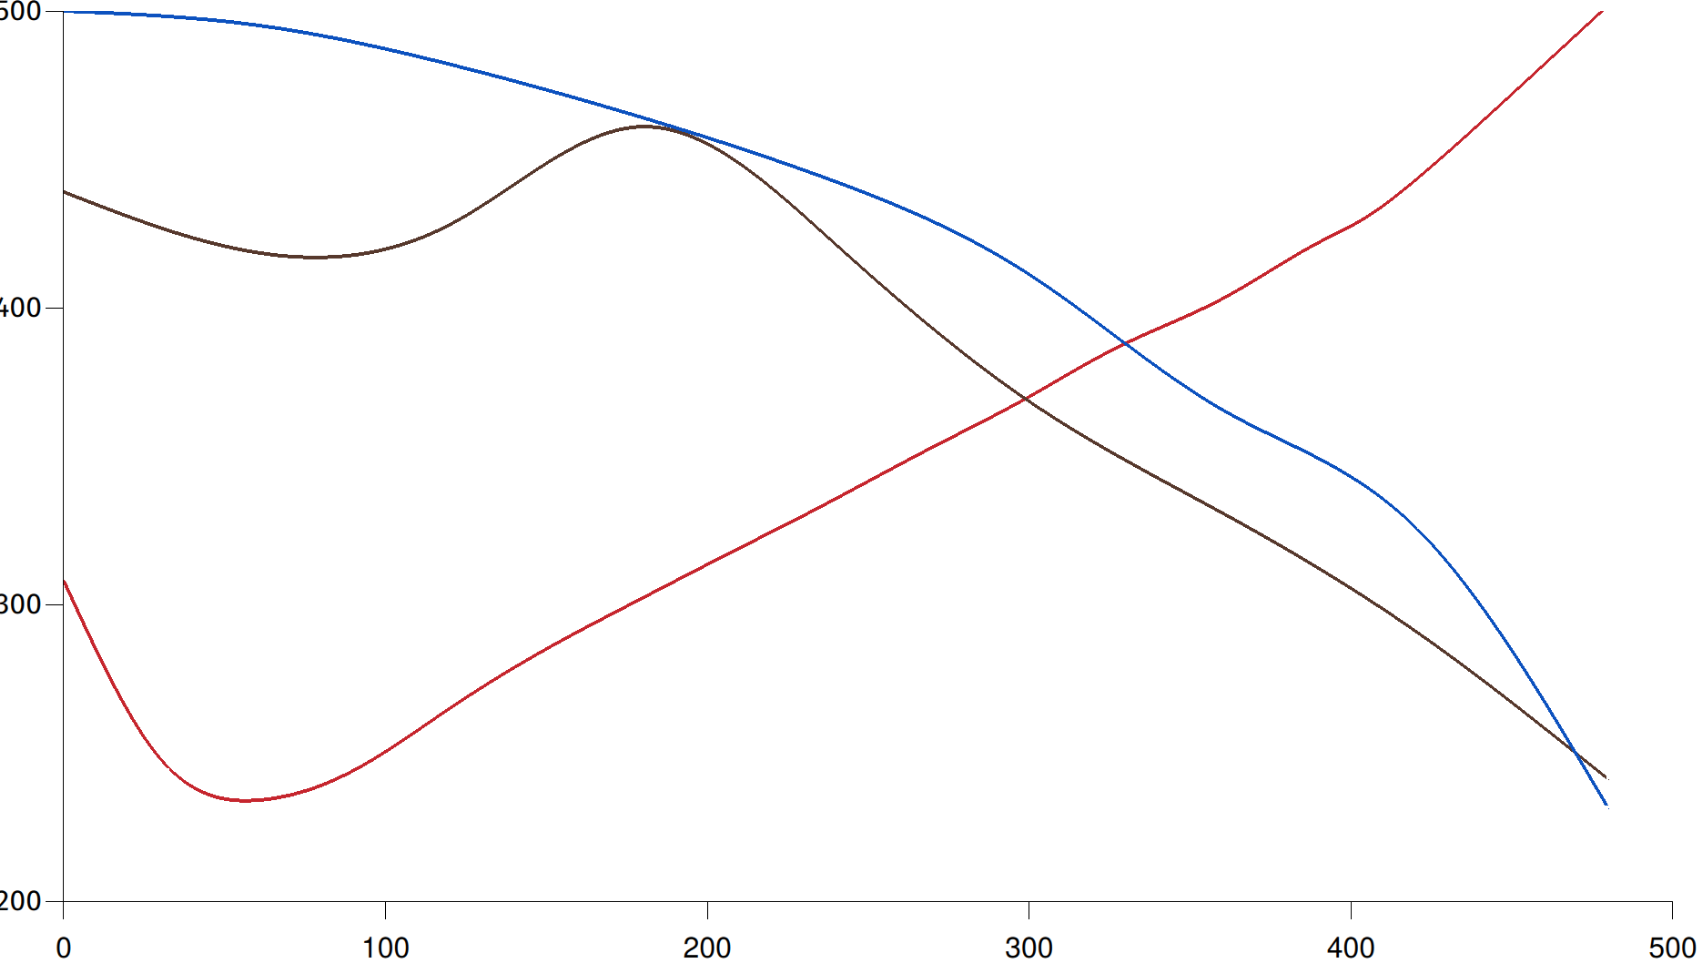
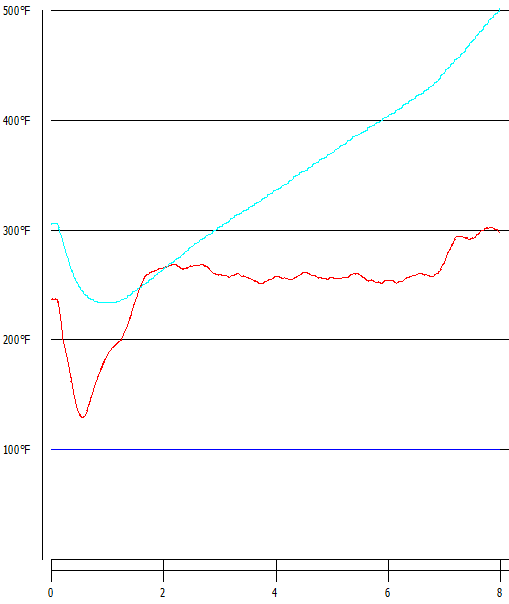
Rate of temperature change and inverse rate of mass change overlaid. This combination of measurements gives you a strong visual indication of blanch point, first crack, and second crack even if you have no idea how my machine calibrates compared with yours. It's also a mess.
Graph in progress. The red line shows temperature over time for a ridiculous super dark 8 minute roast. The brown line doesn't have an axis but it's showing degree of roast over time for that same coffee. The peak in the middle (blanch point) marks the start of chemical changes significant to the finished cup. The blue line (axis also missing) shows mass over time for the same batch. 1st and 2nd cracks are highly visible if you look at the inverse of the rate of change of mass.
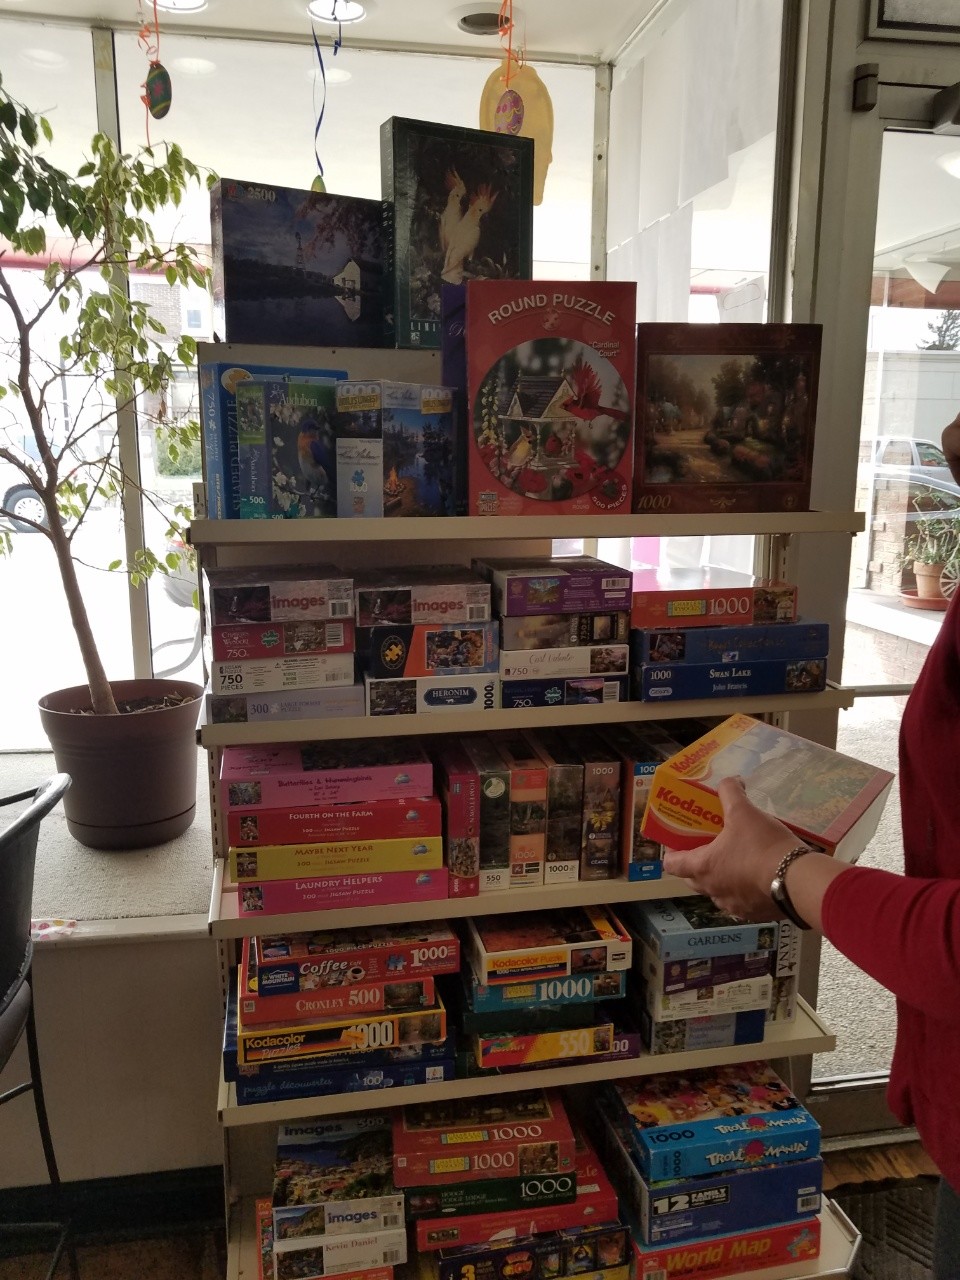
Puzzle shelf is set up and people are already using it. The concept is you can choose a puzzle you like, take it home free, put it together, and when you're done you can bring it back so someone else can enjoy it.
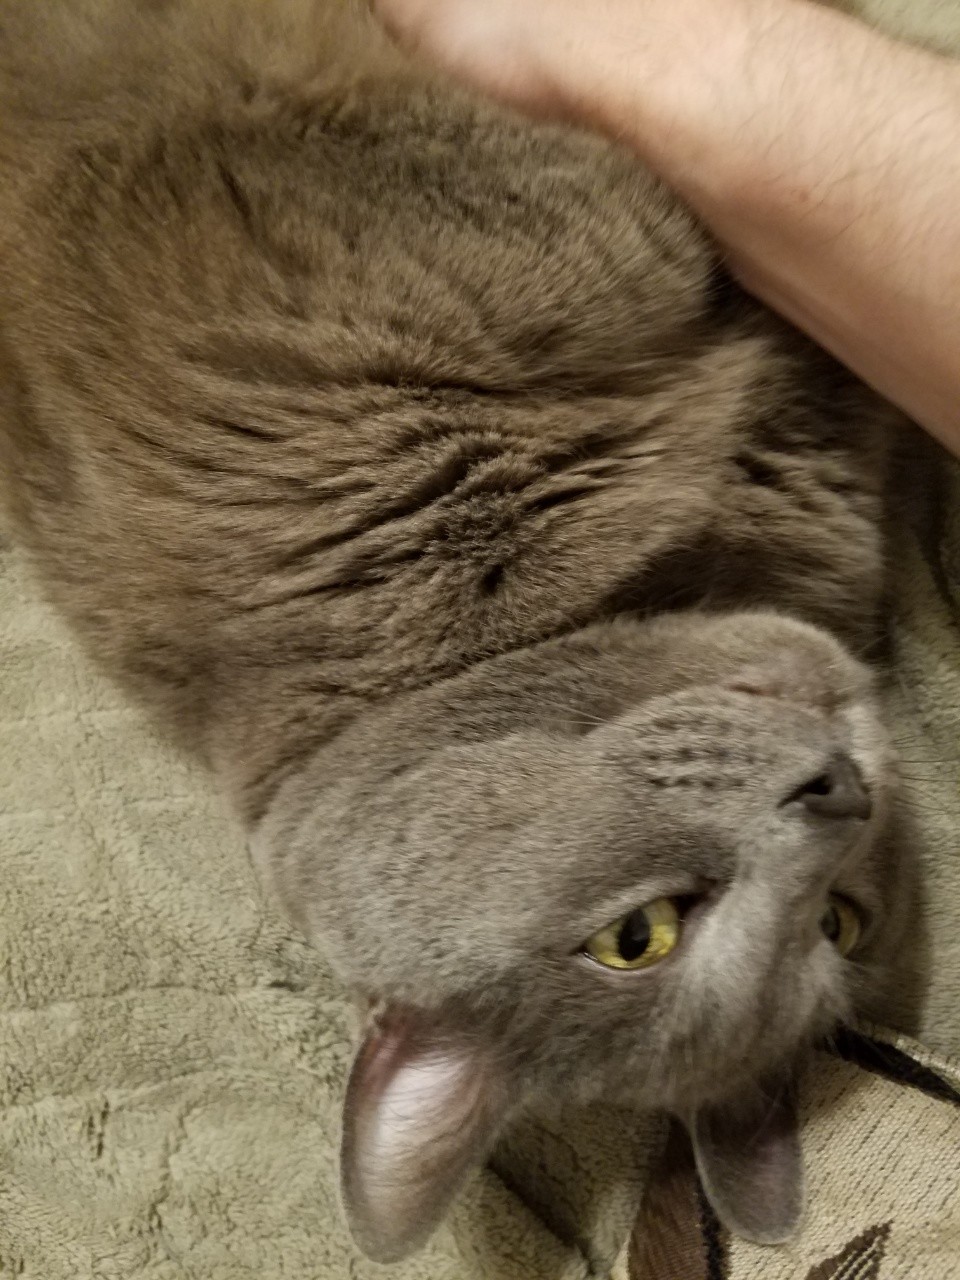
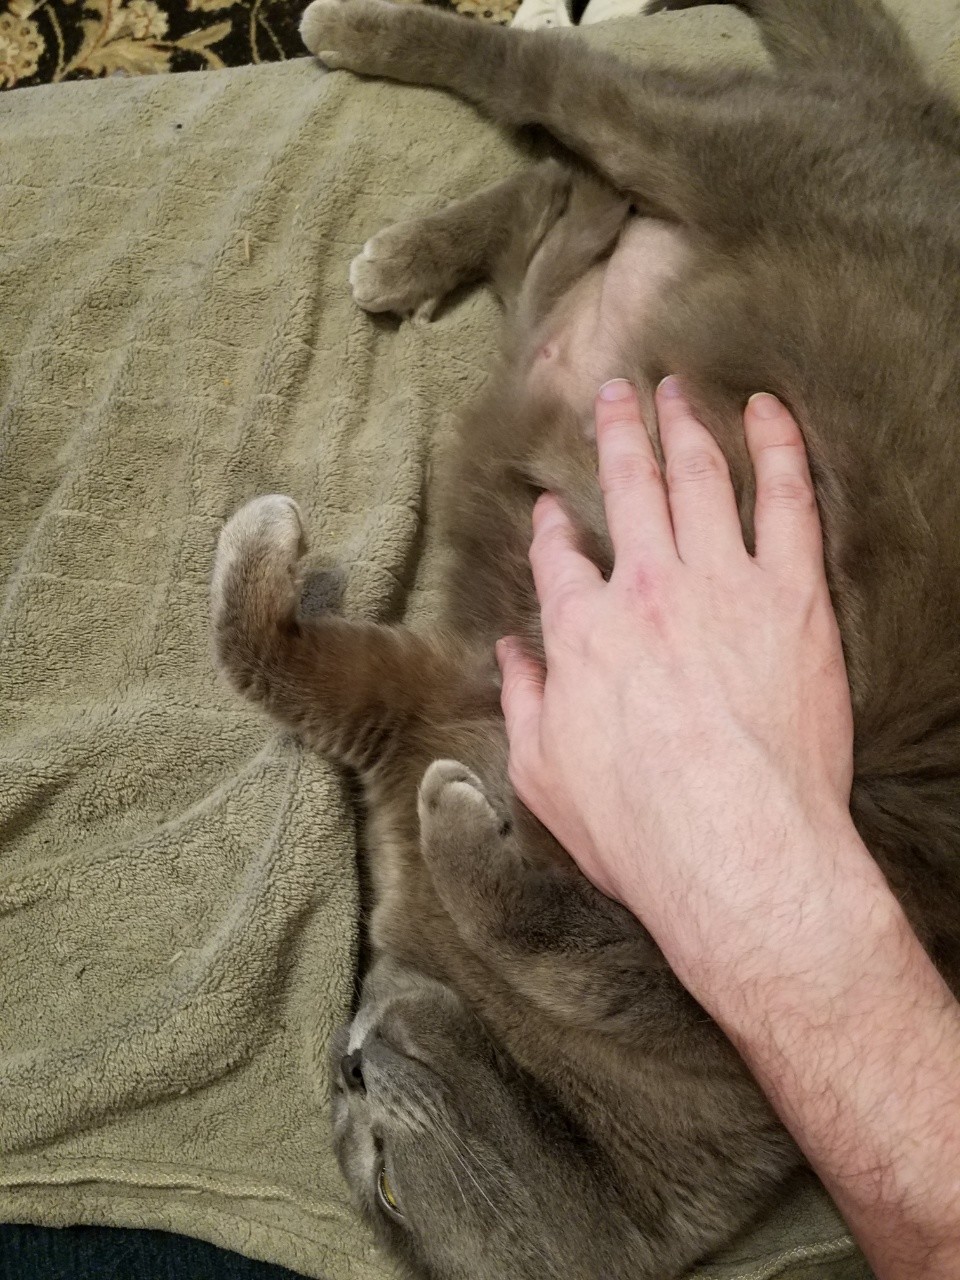
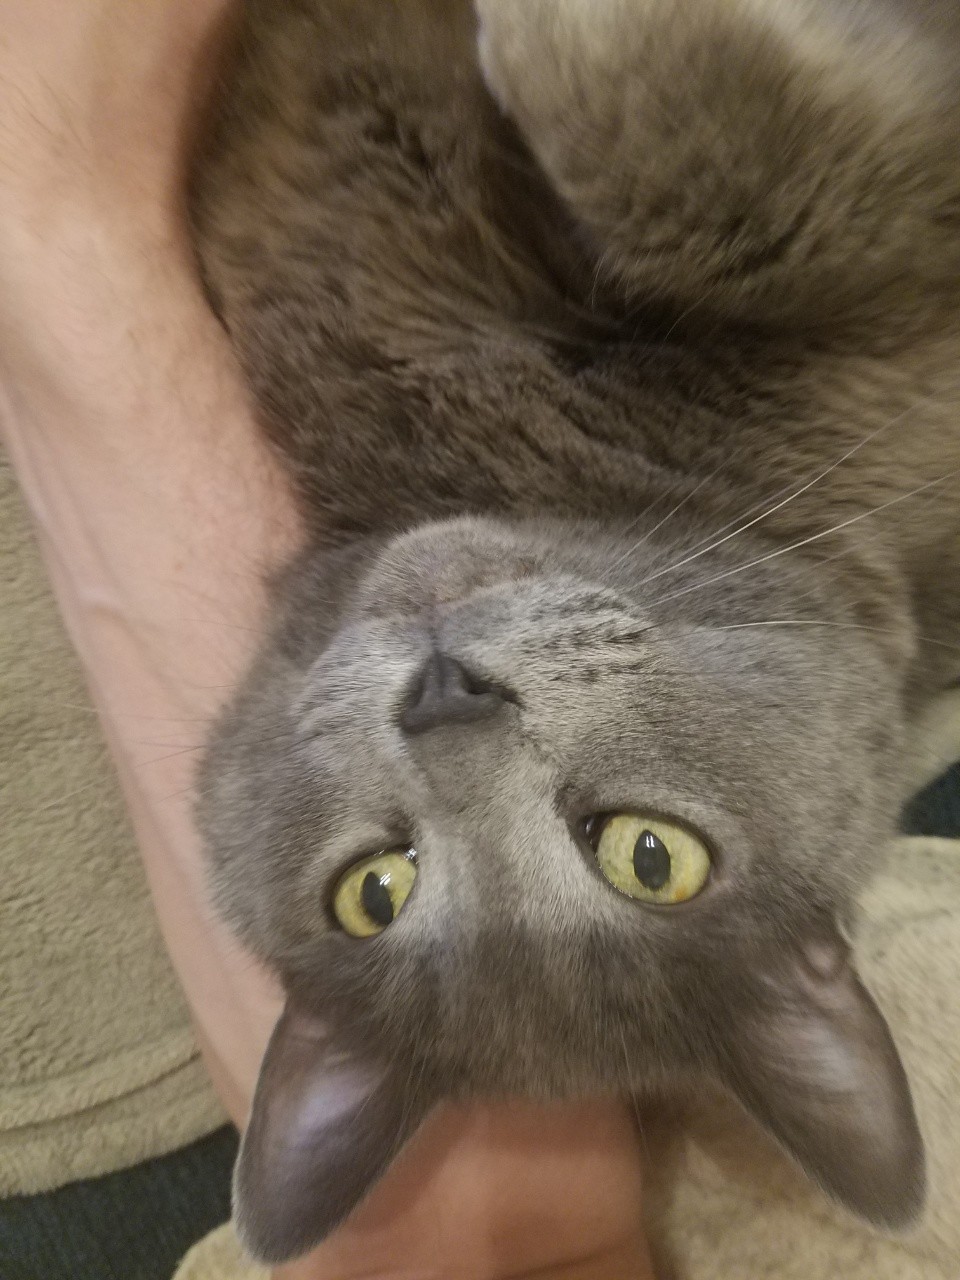
This is my cat this morning letting me know that I should stay home and snuggle with the cat instead of going to work. If enough companies were paying enough money for me to work on Typica full time I'd do a lot of that work at home with the cat. https://typica.us/
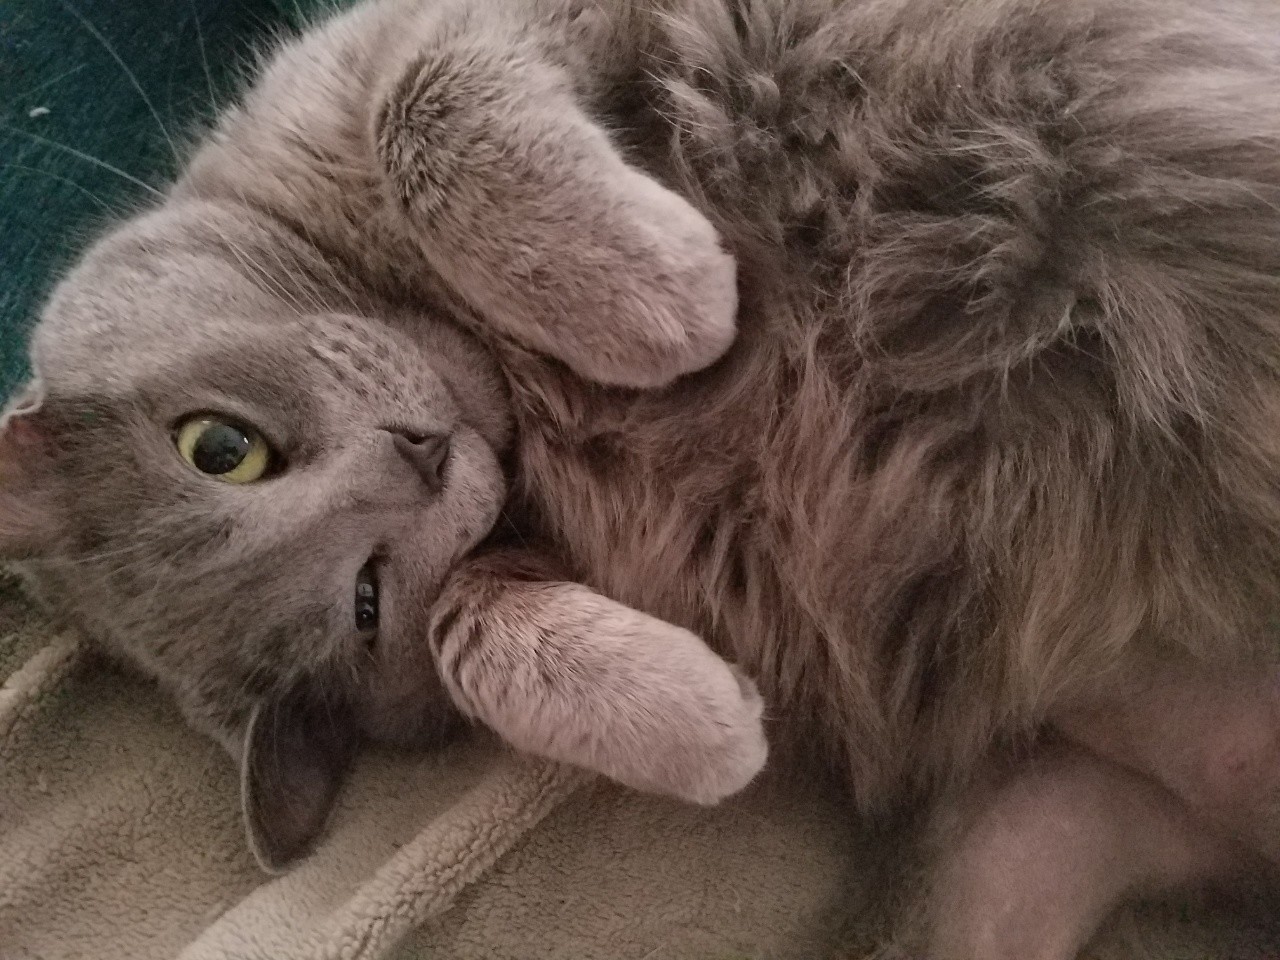
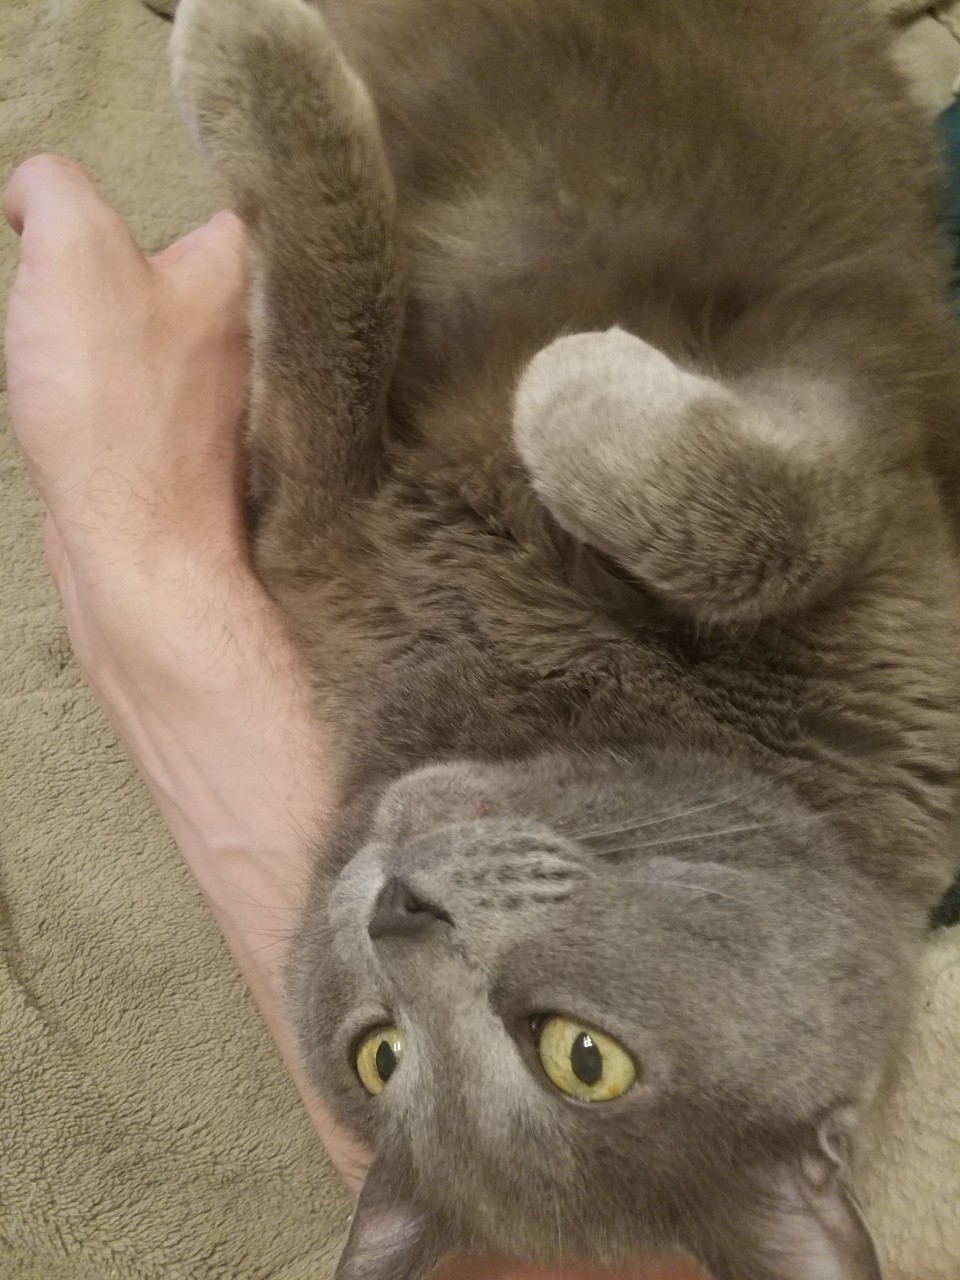
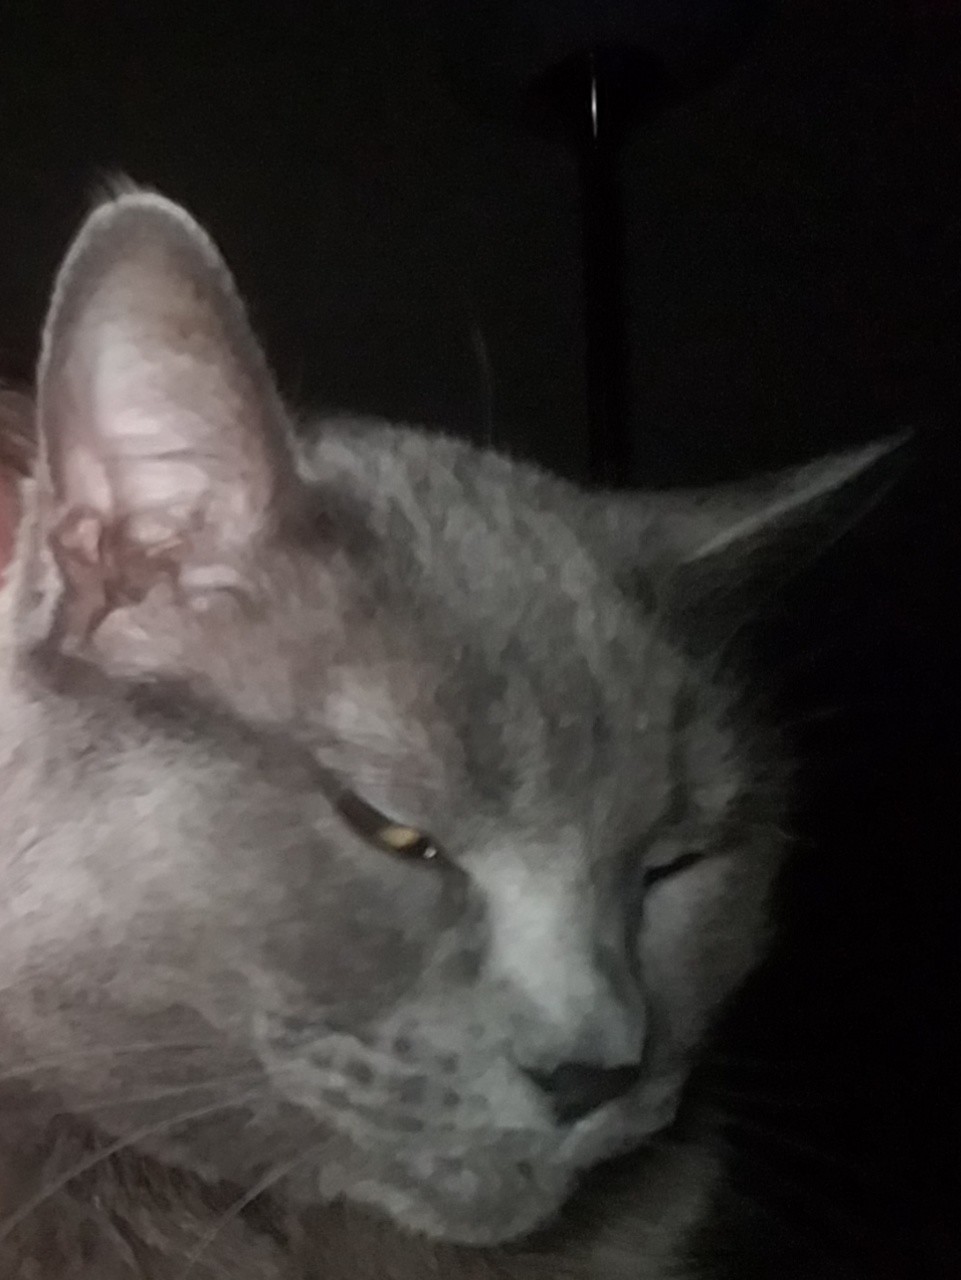
Tonight the cat keeps sitting up, saying meow, and then tipping over onto her back.
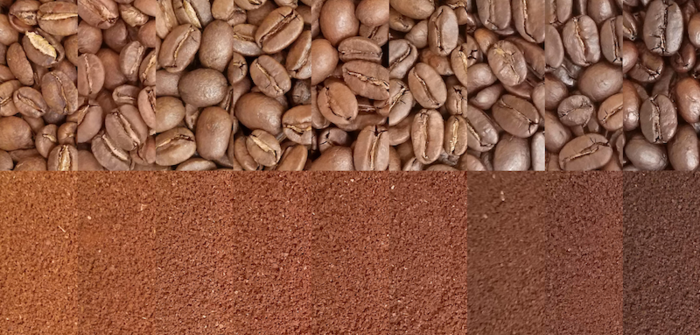
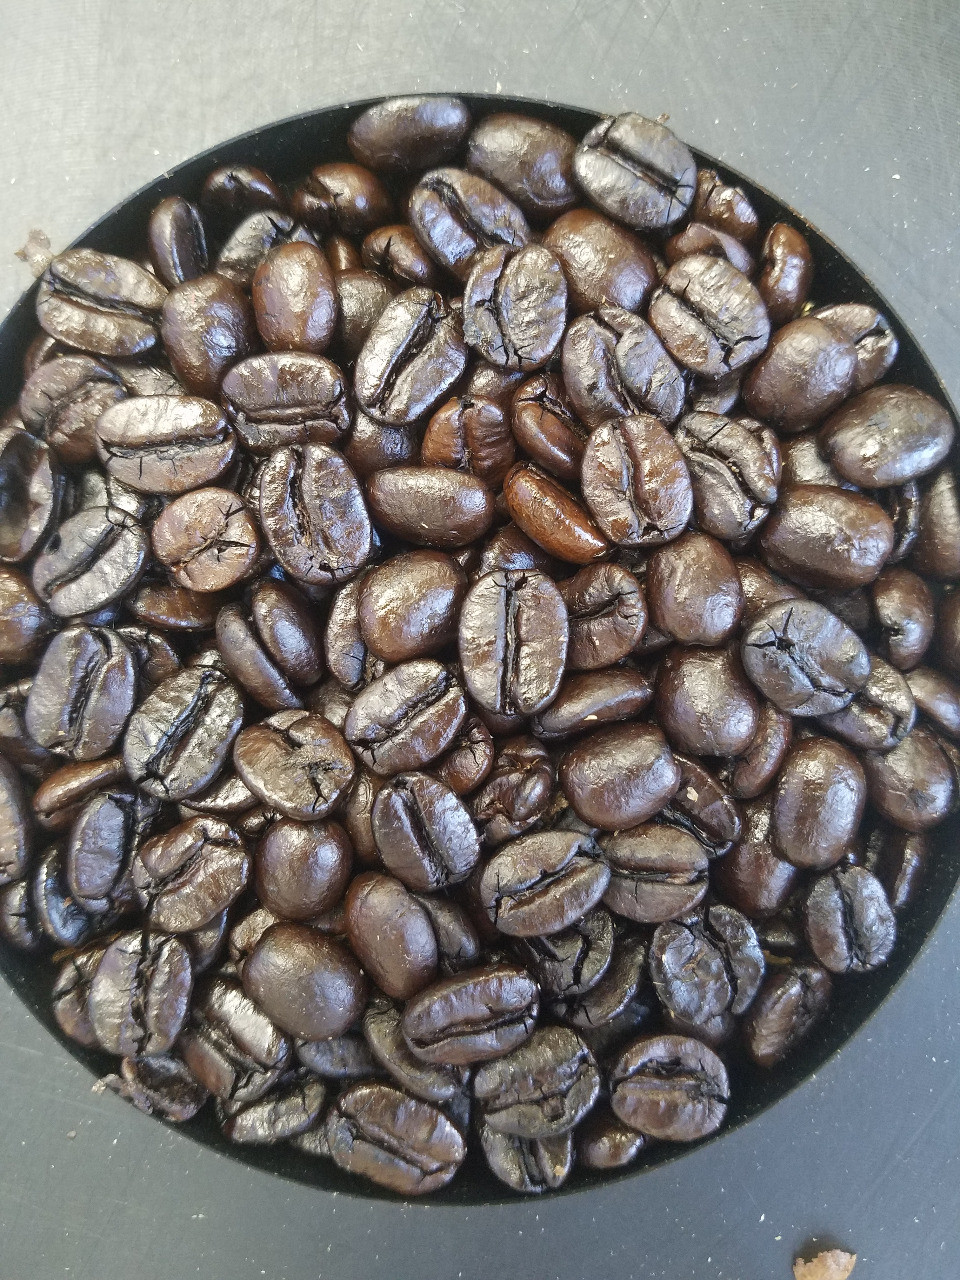
Collecting some data to illustrate some more advanced coffee roasting concepts and I just did an 8 minute roast to an end temperature of 502F (about 40F hotter than my darkest production roast). 22.4% mass loss, gourmet scale 20.5. I don't recommend replicating that at home (if you want it that dark, it's probably better to spend more time and get there at a lower temperature).
- Software
- https://typica.us
- Send Money
- https://typica.us/payment.html
Admin
Author of Typica software for coffee roasters.
Joined Apr 2018